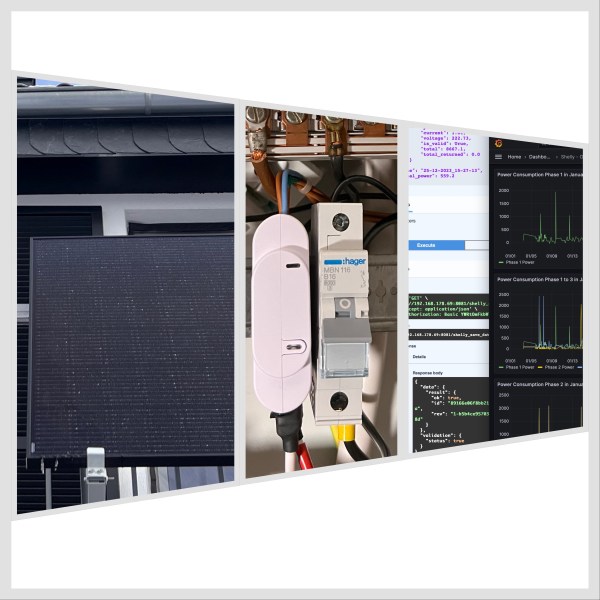
The blog post details an example implementation of a connection server using Shelly 3EM, IBM Cloud Cloudant, and Grafana. It aims to store historical data for visualizing electricity consumption. The project involves detailed architecture, environment setup, Python, FastAPI, Podman, and more usage. The setup covers Raspberry Pi, Podman Compose, and IBM Cloud Code Engine environments, with prerequisites and detailed configurations. The approach allows users to monitor and visualize power consumption efficiently and cost-effectively using Grafana.
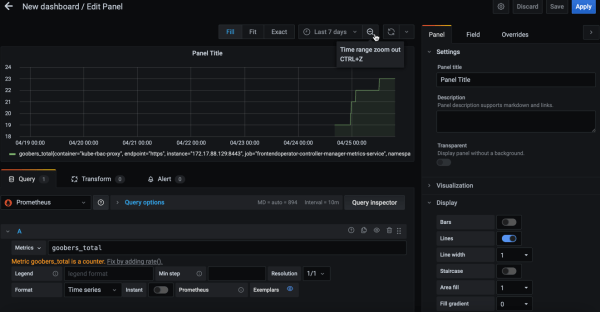
Unleash your creativity and design a custom visualization for the Shelly 3EM device with Grafana