

That blog post does focus on a basic installation of the Grafana operator to get an understanding how that operator basically works in the context to the two blog posts I made before:
We keep going on using the same example GitHub project called Multi Tenancy Frontend Operator.
The following simplified diagram does show the final setup.
Because of the changes in with Prometheus operator installation, please take a look into the blog post “Install the Prometheus Operator using the bundle file“.
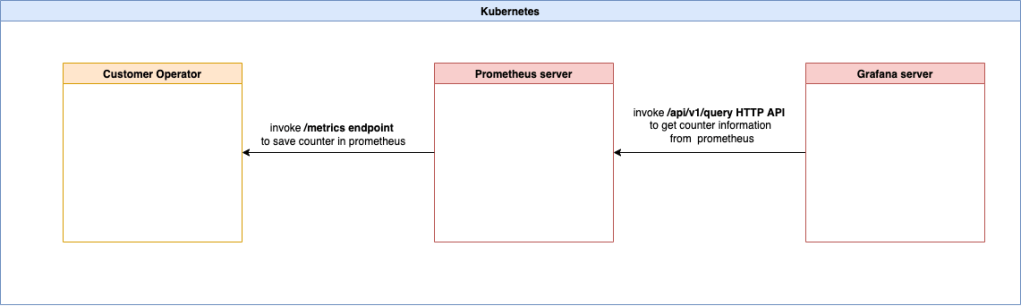
We will have a running instance of our example Multi Tenancy Frontend Operator that exposes metrics to an endpoint for Prometheus to collect the counter data. In Grafana with will add Prometheus as a datasource and we will display the counter query in a Grafana dashboard.
- The datasource in Grafana is the URL to our Prometheus server instance.
- For the configuration of the Grafana dashboard we will utilise the promQL query by invoking the Prometheus HTTP API.
Here is an image of a simple dashboard configured for the goobers_total counter for the Multi Tenancy Frontend Operator.

The blog post is structured in following sections.
- Grafana operator documentation
- Observed differences of the Prometheus and Grafana operator
- Simplified architectural overview
- Technical environment
- Setup the example
- Summary
1. Grafana operator documentation
The Grafana operator has an awesome documentation on GitHub. The installation is documented in Deploying a Grafana instance.
2. Observed differences of the Prometheus and Grafana operator
Before we will have a look at the simplified architecture of the Grafana setup, let us have a look on some differences in the operator configuration for the Grafana and Prometheus operator.
| Operator configuration | Prometheus | Grafana | Impact |
|---|---|---|---|
| Operator scope | cluster-scoped | namespaced-scoped | It wasn’t possible to install the Grafana and the prometheus operator into the same namespace called monitoring. |
Does the Custom Resource Definition for the server instance include the Kubernetes services specifications to access the server UIs? | No | Yes | That means the Prometheus operator gives us the freedom how to configure the external route to the UI with standard Kubernetes resources and you need to create and manage them. The Grafana operator encapsulate the Kubernetes resources such as services for us and we need to find the matching values in the Custom Resource Definition documentation of the Grafana operator. |
3. Simplified architectural overview
Here is a simplified architectural overview diagram. The diagram shows the dependencies of the entire setup. The steps to implement will follow in the next section after the architectural overview.
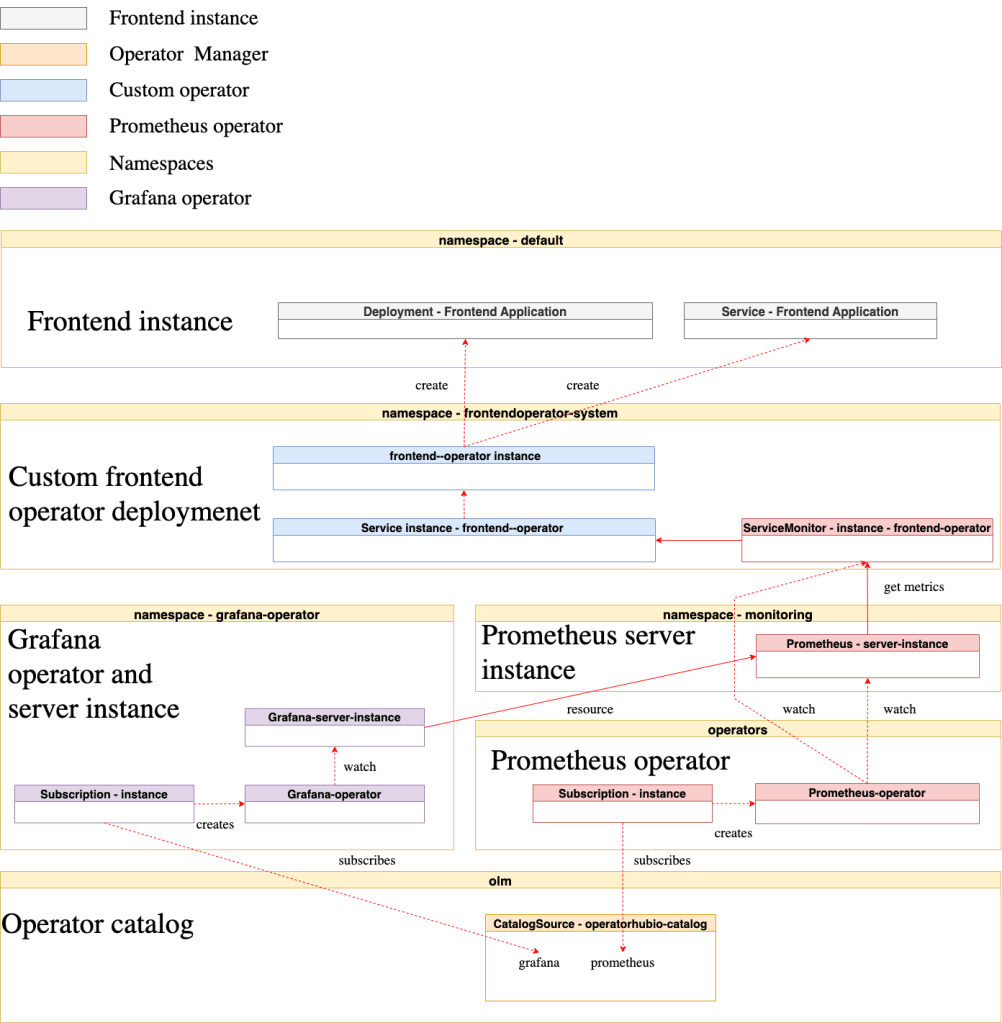
We have 6 relevant namespaces on our Kubernetes cluster in that scenario:
- Grafana-operator
That namespace includes the subscription for the installation of the Grafana Operator, the Grafana Operator instance and the Grafana server instance itself.
- Default
That namespace contains a frontend application deployment created by the example Multi Tenancy Frontend Operator.
- Frontendoperator-system
This namespace contains a deployment of the example Multi Tenancy Frontend Operator to verify if the operator works. That namespace contains a servicemonitor instance which will created by the Prometheus operator and observed by the Prometheus instance. But the servicemonitor specification was created by the Operator SDK.
- Monitoring
The monitoring namespace contains an instance of Prometheus which is managed by the Prometheus operator. Here it’s important to know that this instance is configured to discover all servicemonitors in different namespaces which can be monitored by the Prometheus instance we created. In that context it could be useful to take a look into that stackoverflow question. Servicemonitors can be easily discovered by Prometheus operator and will automatically be mapped to our Prometheus instance we created. For more details please visit the Prometheus operator getting started documentation.
- Operators
That namespace contains a subscription to the operatorhub.io catalog which points to the Prometheus operator and that catalog points to the Prometheus operator bundle installation itself.
- OLM
The Operator Lifecycle Manager (OLM) namespace contains the operatorhub.io catalog.
4. Technical environment
To implement what is described in this blog post, you need to have the following environment, assuming you work on a macOS (other platforms should be almost the same) and an IBM Cloud account.
- Operator SDK
- IBM Cloud Kubernetes service running in a Virtual Private Cloud (VPC)
- Operator Lifecycle Manager (OLM)
- Prometheus operator
- Grafana operator
- golang
- Podman
5. Setup the example
We use from the example project Multi Tenancy Frontend Operator the branch monitoring-grafana-operator. These are the main parts of the setup.
- Install and configure the Prometheus operator and the Multi Tenancy Frontend Operator
- Install and configure the Grafana operator
- Create a Grafana instance
- Configure the Grafana using the UI
5.1. Install the Prometheus operator and the Multi Tenancy Frontend Operator
Step 1: Clone the GitHub project
git clone https://github.com/thomassuedbroecker/multi-tenancy-frontend-operator.git
cd multi-tenancy-frontend-operator/frontendOperator
git ckeckout monitoring-grafana-operator
Step 2: Connect to your cluster on IBM Cloud
ibmcloud login (-sso)
export YOUR_CLUSTERNAME=[YOUR_CLUSTERNAME]
ibmcloud ks cluster config --cluster $YOUR_CLUSTERNAME
kubectl config current-context
Step 3: Setup the existing example with Prometheus
Therefor we only need to execute the bash script. It installs:
- Operator Lifecycle Manager (OLM)
- Prometheus operator
- It deploys the example Operator that is already available on Quay.io
sh prom-create.sh
5.2. Install and configure the Grafana operator
Step 1: Install the Grafana operator
We will use the Grafana operator installation by defining an own subscription based on default subscription configuration available for the OperatorHub.io catalog.
kubectl apply -f grafana-operator-setup.yaml
- Background:
Here is the content of the grafana-operator-setup.yaml file.
- Subscription definition.
apiVersion: operators.coreos.com/v1alpha1
kind: Subscription
metadata:
  name: my-grafana-operator
  namespace: grafana-operator
spec:
  channel: v4
  name: grafana-operator
  source: operatorhubio-catalog
  sourceNamespace: olm
apiVersion: operators.coreos.com/v1
kind: OperatorGroup
metadata:
  name: grafana-operatorgroup
  namespace: grafana-operator
spec:
  targetNamespaces:
  - grafana-operator
- Namespace
apiVersion: v1
kind: Namespace
metadata:
  name: grafana-operator
Step 2: Verify the Grafana operator installation
- Verify the
subscriptions
kubectl get subscriptions -n grafana-operator
- Example output:
NAME                  PACKAGE            SOURCE                  CHANNEL
my-grafana-operator   grafana-operator   operatorhubio-catalog   v4
- Verify the
installplans
kubectl get installPlan -n grafana-operator
- Example output:
NAME            CSV                       APPROVAL    APPROVED
install-2w2lz   grafana-operator.v4.2.0   Automatic   true
- Verify
cluster service versions
kubectl get csv -n grafana-operator
kubectl get csv
- Example output:
The following output shows that the Grafana operator is namespace scoped and the Prometheus operator is cluster scoped.
NAME                        DISPLAY               VERSION   REPLACES                    PHASE
grafana-operator.v4.2.0     Grafana Operator      4.2.0     grafana-operator.v4.1.1     Succeeded
prometheusoperator.0.47.0   Prometheus Operator   0.47.0    prometheusoperator.0.37.0   Succeeded
NAME                        DISPLAY               VERSION   REPLACES                    PHASE
prometheusoperator.0.47.0   Prometheus Operator   0.47.0    prometheusoperator.0.37.0   Succeeded
- Verify the created custom resource definitions
kubectl get crds -n grafana-operator | grep "graf"
- Example output:
grafanadashboards.integreatly.org                     2022-04-Z
grafanadatasources.integreatly.org                    2022-04-Z
grafananotificationchannels.integreatly.org           2022-04-Z
grafanas.integreatly.org                              2022-04-Z
5.3. Create a Grafana instance
Step 1: Create a Grafana instance
Execute following command:
kubectl apply -f ./grafana-instance.yaml -n grafana-operator
- Example output:
grafana.integreatly.org/example-grafana created
- Background:
The detailed information for the Grafana deployment we find in the Grafana documentation. I will use some of the extracts here.
Here is the link to the grafana-instance.yaml file.
In the file we see following sections:
- client: Grafana client options (see here).
- “config: The properties used to generate grafana.ini. All properties defined in the official documentation are supported although some of them are not allowed to be overridden (path configuration).“
- “service: Allows configuring the Service resource (see here).“Here we configure a
LoadBalancerwith additional annotation needed by IBM Cloud. - “dashboardLabelSelector: A list of either matchLabels or matchExpressions to filter the dashboards before importing them.“
- “resources: Allows configuring the requests and limits for the Grafana pod ( see here).“
apiVersion: integreatly.org/v1alpha1
kind: Grafana
metadata:
  name: example-grafana
spec:
  client:
    preferService: true
  config:
    security:
      admin_user: admin
      admin_password: admin
    log:
      mode: "console"
      level: "error"
    log.frontend:
      enabled: true
    auth:
      disable_login_form: False
      disable_signout_menu: True
    auth.anonymous:
      enabled: True
  service:
    name: "grafana-service"
    labels:
      app: "grafana"
    annotations: # Additional annotations for the Service
      app: grafana
      service.kubernetes.io/ibm-load-balancer-cloud-provider-ip-type: "public" # ibm cloud specific
    type: LoadBalancer  # Set Service type, either NodePort, ClusterIP or LoadBalancer
    ports: # Additional ports to add to the service
      - name: grafana-proxy
        protocol: TCP
  dashboardLabelSelector:
    - matchExpressions:
        - { key: app, operator: In, values: [grafana] }
  resources:
    # Optionally specify container resources
    limits:
      cpu: 200m
      memory: 200Mi
    requests:
      cpu: 100m
      memory: 100Mi
Step 2: Verify the Grafana instance creation
kubectl get service -n grafana-operator
- Example output:
NAME                                                  TYPE           CLUSTER-IP      EXTERNAL-IP                            PORT(S)          AGE
grafana-operator-controller-manager-metrics-service   ClusterIP      172.21.64.44    <none>                                 8443/TCP         69s
grafana-service                                       LoadBalancer   172.21.46.241   86051139-us-south.lb.appdomain.cloud   3000:32547/TCP   20s
5.4. Configure the Grafana using the UI
Step 1: Access the Grafana UI
EXTERNAL_IP=$(kubectl get service grafana-service -n grafana-operator | grep grafana-service |  awk '{print $4;}')
echo "Access Grafana UI: http://$EXTERNAL_IP:3000"
- Example output:
Access Grafana UI: http://XXXXXX-us-south.lb.appdomain.cloud:3000
Step 2: Access the Grafana UI
The following gif shows how to log in.
- User:
admin - Password:
admin

REMEMBER: This is only an example configuration to learn and understand.
Step 3: Get the Prometheus server URL
Get the Prometheus server URL.
EXTERNAL_IP=$(kubectl get service prometheus -n monitoring | grep prometheus |  awk '{print $4;}')
PORT=$(kubectl get service prometheus -n monitoring | grep prometheus |  awk '{print $5;}'| sed 's/\(.*\):.*/\1/g')
echo "Access Prometheus server URL: http://$EXTERNAL_IP:$PORT"
- Example output:
Access Prometheus server URL: http://XXXXX-us-south.lb.appdomain.cloud:9090
Step 4: Create a data source in Grafana using the Prometheus server URL
The following gif shows.
- Select
Configuationfrom the sidebar menu - Open
Data Sources - Press
Add Data Source - Choose
Prometheus - Insert the Prometheus server URL in
HTTPsection for theURLvalue - Press
Save and Test

Step 5: Create a dashboard in Grafana
The following gif shows.
- Select
+from the sidebar menu - Open
Dashboard - Press
Add an empty panel - Choose
goobers - Select
goobers_total - Open
Absolute time rangeand configure it to your needs

6. Summary
As we have seen the setup and configuration of the Grafana operator is different to the Prometheus operator. The last 3 blog posts including this one, this was only a starting point for the topic metrics in context of operator development. There is an awesome open sourced GitHub project called Kubernetes Operator Samples using Go, the Operator SDK and OLM that is maybe also useful for future topics related to operators development.
I hope this was useful to you and let’s see what’s next?
Greetings,
Thomas
#olm, #operatorsdk, #kubernetes, #operator, #operatorlearningjourney, #golang, #prometheus, #metrics, #grafanaoperator, #grafana
