
That blog post does focus on a customized monitoring with Prometheus for a custom operator implementation build with the golang Operator SDK. For the monitoring we will use the Prometheus operator. Alain Arom and I inspected that topic and here we show you one example hands-on journey how to get the technical job done. There are a lot of materials out there, but in that blog post we follow an end-to-end scenario for a beginner to intermediate level (without any stop in the middle 😉 of the road). We will only focus on: how it basically works and not why or what we should do in monitoring.
It’s useful to take a look at my blog post A simple GO operator development learning journey, when you start to dig into the topic operator development with golang.
Because of the changes in with Prometheus operator installation, please take a look into the blog post “Install the Prometheus Operator using the bundle file“.
Objective
The objective for us is to show how do we implement that customized monitoring that is mentioned above.
Therefor we setup and run an integration of the custom operator and Prometheus operator on a Kubernetes cluster. We will implement a counter how to monitor how often our reconcile function of our custom operator controller is invoked. There we will use an increment method of the Prometheus counter inside our custom operator controller implementation. Later we access and examine the counter information in the Prometheus – ui.
Overview
Let’s see how we will realize the implementation.
We start with the implementation to increment a custom Prometheus counter in our existing example Multi Tenancy Frontend Operator project. Then we run the operator locally to examine if the /metrics endpoint provides the information of our counter.
Note: In that context it’s useful to take a look into the Red Hat OpenShift documentation.
After we have validated that the /metrics endpoint works, we will install the Operator Lifecycle Manager (OLM) and the Prometheus operator in our Kubernetes cluster.
Then we need to setup a Prometheus instance. For that instance we need a service account, a cluster role and a cluster role binding to provide the needed rights to access the Kubernetes resources. We also need a load balancer to expose the Prometheus web ui to the internet.
Now we build a container image for the operator that includes our changes, and we upload that container image to a container registry.
To use the ‘out of the box‘ integration with Prometheus provided by the Operator SDK configuration, we need to run our operator on the Kubernetes cluster. We will run the operator as a deployment. The deployment will deploy the needed Kubernetes configurations for the resources. One of the resources is called servicemonitor. The servicemonitor is a Prometheus operator resource and enables the Prometheus instance to discover metrics sources automatically. Then we will also create an instance of our frontend application (mentioned earlier) with our custom operator.
After all that steps we are ready to inspect the Prometheus UI. In the Prometheus UI we can verify if our operator target and the newly created counter is available.
Hereafter we see the sequence to follow along when we use the example code in the Multi Tenancy Frontend Operator project:
- Local implementation
- Run the frontend operator locally
- Install the Operator Lifecycle Manager (OLM) and the Prometheus operator on a Kubernetes cluster
- Setup a Prometheus instance
- Use a deployment to run the custom operator in the cluster
- Verify the Prometheus UI
The final implementation is available on the branch monitoring-basic-operator Multi Tenancy Frontend Operator.
Simplified architectural overview
Let us have an architectural overview by using the following diagram. The diagram shows a simplified overview of the dependencies of the entire setup. The steps to implement will follow in the next section after the architectural overview.

We have five relevant namespaces on our Kubernetes cluster in that scenario:
- default
That namespace contains a frontend application deployment created by the example Multi Tenancy Frontend Operator.
- Frontendoperator-system
This namespace contains a deployment of the example Multi Tenancy Frontend Operator to verify if the operator works. That namespace contains a servicemonitor instance which will created by the Prometheus operator and observed by the Prometheus instance. But the servicemonitor specification was created by the Operator SDK.
- Monitoring
The monitoring namespace contains an instance of Prometheus which is managed by the Prometheus operator. Here it’s important to know that this instance is configured to discover all servicemonitors in different namespaces which can be monitored by the Prometheus instance we created. In that context it could be useful to take a look into that stackoverflow question. Servicemonitors can be easily discovered by Prometheus operator and will automatically be mapped to our Prometheus instance we created. For more details please visit the Prometheus operator getting started documentation.
- Operators
That namespace contains a subscription to the operatorhub.io catalog which points to the Prometheus operator and that catalog points to the Prometheus operator bundle installation itself.
- OLM
The Operator Lifecycle Manager (OLM) namespace contains the operatorhub.io catalog.
In the diagram we see labels and selectors for the servicemonitor and the Prometheus instance. With the selector definition for the Prometheus instance we see the important brackets {} . These brackets indicating that we don’t want to specify any specific label that our Prometheus instance has to look for when it searches for the available servicemonitors. The Prometheus instance is allowed to show all servicemonitors which are available.
The servicemonitor points to the service of the application where we get the monitoring information. That selector defines which label the servicemonitor is looking for in the a service specification. It’s great that we don’t need to define all that labels and selectors for our customer operator, that is managed for us by using the Operator SDK.
- Prometheus instance (we need to define)
spec:
  serviceAccountName: prometheus
  serviceMonitorSelector: {}
  serviceMonitorNamespaceSelector: {}
- servicemonitor (will be created by the Operator SDK)
selector:
  matchLabels:
     control-plane: controller-manager
- service (will be created by the Operator SDK)
labels:
    control-plane: controller-manager
Technical environment
To implement what is described in this blog post, you need to have the following environment, assuming you work on a macOS (other platforms should be almost the same) and an IBM Cloud account.
- Operator SDK
- IBM Cloud Kubernetes service running in a Virtual Private Cloud (VPC)
- Operator Lifecycle Manager (OLM)
- Prometheus operator
- golang
1. Local implementation
Let’s start with our journey to setup a running end-to-end example by using the Multi Tenancy Frontend Operator project.
In that context the documentation for configure the Prometheus metrics in the operator-sdk can be useful.
Step 1: Setup the project
git clone https://github.com/thomassuedbroecker/multi-tenancy-frontend-operator.git
cd multi-tenancy-frontend-operator/frontendOperator
Step 2: Enable Prometheus for the monitoring
Open the file config/default/kustomize.yaml and uncomment following line.
# [PROMETHEUS] To enable prometheus monitor, uncomment all sections with 'PROMETHEUS'.
- ../prometheus
That will create a new folder later called prometheues automatically, which will contain a servicemonitor specification file called monitor.yaml for the later usage with the Prometheus operator.
# Prometheus Monitor Service (Metrics)
apiVersion: monitoring.coreos.com/v1
kind: ServiceMonitor
metadata:
  labels:
    control-plane: controller-manager
  name: controller-manager-metrics-monitor
  namespace: system
spec:
  endpoints:
    - path: /metrics
      port: https
      scheme: https
      bearerTokenFile: /var/run/secrets/kubernetes.io/serviceaccount/token
      tlsConfig:
        insecureSkipVerify: true
  selector:
    matchLabels:
      control-plane: controller-manager
Step 3: Create a file called controllers/push_metrics.go
In the following code we register new counters for our operator metrics. Insert following code to the file you created.
package controllers

import (
    "github.com/prometheus/client_golang/prometheus"
    "sigs.k8s.io/controller-runtime/pkg/metrics"
)

var (
    goobers = prometheus.NewCounter(
        prometheus.CounterOpts{
            Name: "goobers_total",
            Help: "Number of goobers proccessed",
        },
    )
    gooberFailures = prometheus.NewCounter(
        prometheus.CounterOpts{
            Name: "goober_failures_total",
            Help: "Number of failed goobers",
        },
    )
)

func init() {
    // Register custom metrics with the global prometheus registry
    metrics.Registry.MustRegister(goobers, gooberFailures)
}
Step 4: Open the file called controllers/tenancyfrontend_controller.go
In the Reconcile function add following code to increase the counter at each invocation.
logger := log.FromContext(ctx)
...
// Add metrics information
goobers.Inc()
gooberFailures.Inc()
...
2. Run the frontend operator locally
Step 1: Execute following commands to prepare to run the operator
make generate
make manifests
Step 2: Run the operator locally
make install run
Step 3: Open the metrics locally
open http://localhost:8080/metrics
- Example output:

The main.go file contains the port and metrics endpoint information.
    ...
    flag.StringVar(&metricsAddr, "metrics-bind-address", ":8080", "The address the metric endpoint binds to.")
    ...
    mgr, err := ctrl.NewManager(ctrl.GetConfigOrDie(), ctrl.Options{
        Scheme:                 scheme,
        MetricsBindAddress:     metricsAddr,
        Port:                   9443,
        HealthProbeBindAddress: probeAddr,
        LeaderElection:         enableLeaderElection,
        LeaderElectionID:       "70035c77.example.net",
    })
    ...
3. Install the Operator Lifecycle Manager (OLM) and the Prometheus operator on a Kubernetes cluster
Step 1: Install Operator Lifecycle Manager (OLM)
operator-sdk olm install latest
Step 2: Create a monitoring namespace
kubectl create namespace monitoring
Step 3: Install Prometheus operator
kubectl get catalogsource -n olm | grep "operatorhubio-catalog"
kubectl create -f https://operatorhub.io/install/prometheus.yaml
Step 4: Create a service account
- Create a
prom-serviceaccount.yamlfile and insert following code
apiVersion: v1
kind: ServiceAccount
metadata:
  name: prometheus
- Apply the
yaml
kubectl apply -f prom-serviceaccount.yaml -n monitoring
Step 5: Create a cluster role
- Create a
prom-clusterrole.yamlfile and insert following code
apiVersion: rbac.authorization.k8s.io/v1
kind: ClusterRole
metadata:
  name: prometheus
rules:
- apiGroups: [""]
  resources:
  - nodes
  - nodes/metrics
  - services
  - endpoints
  - pods
  verbs: ["get", "list", "watch"]
- apiGroups: [""]
  resources:
  - configmaps
  verbs: ["get"]
- apiGroups:
  - networking.k8s.io
  resources:
  - ingresses
  verbs: ["get", "list", "watch"]
- nonResourceURLs: ["/metrics"]
  verbs: ["get"]
- Apply the
yaml
kubectl apply -f prom-clusterrole.yaml -n monitoring
Step 6: Create a cluster role binding
- Create a
prom-clusterrolebinding.yamlfile and insert following code
apiVersion: rbac.authorization.k8s.io/v1
kind: ClusterRoleBinding
metadata:
  name: prometheus
roleRef:
  apiGroup: rbac.authorization.k8s.io
  kind: ClusterRole
  name: prometheus
subjects:
- kind: ServiceAccount
  name: prometheus
  namespace: monitoring
- Apply the
yaml
kubectl apply -f prom-clusterrolebinding.yaml -n monitoring
4. Setup a Prometheus instance
Step 1: Prometheus instance
- Create a
prom-instance.yamlfile and insert following code
apiVersion: monitoring.coreos.com/v1
kind: Prometheus
metadata:
  name: prometheus
spec:
  serviceAccountName: prometheus
  serviceMonitorSelector: {}
  serviceMonitorNamespaceSelector: {}
  resources:
    requests:
      memory: 400Mi
  enableAdminAPI: true
- Apply the
yaml
kubectl apply -f prom-instance.yaml -n monitoring
- Verify
kubectl get prometheus -n monitoring
NAME         VERSION   REPLICAS   AGE
prometheus                        71s
Step 2: Expose the Prometheus UI
Create a file called prom-loadbalancer.yaml and copy following code. The following annotations configuration of the loadbalancer is specific to a running a Kubernetes cluster on IBM Cloud in VPC.
apiVersion: v1
kind: Service
metadata:
  name: prometheus
  annotations:
    service.kubernetes.io/ibm-load-balancer-cloud-provider-ip-type: "public"
spec:
  type: LoadBalancer
  ports:
  - name: web
    port: 9090
    protocol: TCP
    targetPort: 9090
  selector:
    prometheus: prometheus
- Apply the
yaml
kubectl apply -f prom-loadbalancer.yaml -n monitoring
- Get the service and external route to the Prometheus ui
EXTERNAL_IP=$(kubectl get service prometheus -n monitoring | grep prometheus |  awk '{print $4;}')
PORT=$(kubectl get service prometheus -n monitoring | grep prometheus |  awk '{print $5;}'| sed 's/\(.*\):.*/\1/g')
echo "http://$EXTERNAL_IP:$PORT"
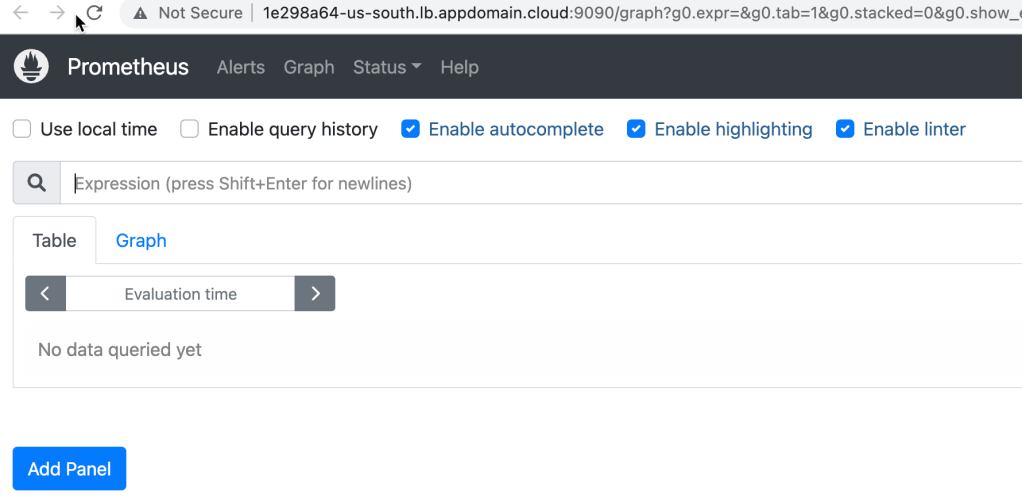
- Example output
http://1e298a64-us-south.lb.appdomain.cloud:9090
Step 3: Open the link above in the browser
5. Use a deployment to run the custom operator in the cluster
Step 1: Create the container image
export REGISTRY='quay.io'
export ORG='tsuedbroecker'
export CONTROLLER_IMAGE='frontendcontroller-monitoring:v0.0.1'
make generate
make manifests
make docker-build IMG="$REGISTRY/$ORG/$CONTROLLER_IMAGE"
Step 2: Push the container image
docker push "$REGISTRY/$ORG/$CONTROLLER_IMAGE"
Step 3: Deploy the operator to the cluster
make deploy IMG="$REGISTRY/$ORG/$CONTROLLER_IMAGE"
kubectl apply -f config/samples/multitenancy_v1alpha1_tenancyfrontend.yaml -n default
- Example output
/multi-tenancy-frontend-operator/frontendOperator/bin/controller-gen rbac:roleName=manager-role crd webhook paths="./..." output:crd:artifacts:config=config/crd/bases
cd config/manager && /Users/thomassuedbroecker/Downloads/dev/multi-tenancy-frontend-operator/frontendOperator/bin/kustomize edit set image controller=quay.io/tsuedbroecker/frontendcontroller-monitoring:v0.0.1
/multi-tenancy-frontend-operator/frontendOperator/bin/kustomize build config/default | kubectl apply -f -
namespace/frontendoperator-system created
customresourcedefinition.apiextensions.k8s.io/tenancyfrontends.multitenancy.example.net created
serviceaccount/frontendoperator-controller-manager created
role.rbac.authorization.k8s.io/frontendoperator-leader-election-role created
clusterrole.rbac.authorization.k8s.io/frontendoperator-manager-role created
clusterrole.rbac.authorization.k8s.io/frontendoperator-metrics-reader created
clusterrole.rbac.authorization.k8s.io/frontendoperator-proxy-role created
rolebinding.rbac.authorization.k8s.io/frontendoperator-leader-election-rolebinding created
clusterrolebinding.rbac.authorization.k8s.io/frontendoperator-manager-rolebinding created
clusterrolebinding.rbac.authorization.k8s.io/frontendoperator-proxy-rolebinding created
configmap/frontendoperator-manager-config created
service/frontendoperator-controller-manager-metrics-service created
deployment.apps/frontendoperator-controller-manager created
servicemonitor.monitoring.coreos.com/frontendoperator-controller-manager-metrics-monitor created
tenancyfrontend.multitenancy.example.net/tenancyfrontendsample created
- verify if the
servicemonitoris available
kubectl get servicemonitor -n frontendoperator-system -oyaml
6. Verify the Prometheus UI
Now we can verify the targets and the goobers_total. The gif below show the example Prometheus ui and how we search for the target and the goobers_total.

7. Summary
It’s (as always ;-)) pretty easy to add custom monitoring to your custom operator by using the Prometheus operator, when you know how. You really should to be familiar how labelling inside Kubernetes works, in that case and also how operators are used and how you develop them. There is an awesome open sourced GitHub project called Kubernetes Operator Samples using Go, the Operator SDK and OLM that is maybe also useful for future topics related to operators development.
8. Additional resources
List of additional resources related to the topics operator development, Prometheus, and Prometheus operator.
- Install Prometheus and Grafana on Kubernetes using Helm
- Using Service Monitors
- Metrics Kubebuilder documentation
- How to install Prometheus and Grafana on Kubernetes using Helm 3
- Configure Prometheus metrics
- Prometheus operator beginners guide
- Kubernetes monitoring Prometheus
- Prometheus tutorial detailed guide to getting started
- Get started with Prometheus with three easy projects
- Prometheus metrics microprofile microservices istio
- Prometheus installation
- How to create a service monitor for Prometheus operator
- Exporting metrics for Prometheus
- Prometheus operator getting started
- Red Hat documentation osdk-monitoring-prometheus
- Prometheus definitive guide part III – Prometheus operator
- Prometheus operator helm guide
- IBM Cloud documentation scrape
- Prometheus operator api
- How to add multiple ServiceMonitor to PrometheusOperator object
I hope this was useful to you and let’s see what’s next?
Greetings,
Thomas
#olm, #operatorsdk, #kubernetes, #operator, #operatorlearningjourney, #golang, #prometheus, #metrics
