

This blog post is about: How to run the example Multi Tenancy Frontend Operator as a deployment on a Kubernetes cluster.
We use my existing example from various blog posts I wrote which uses the Operator SDK. Surely the tutorial of the Operator SDK can be very useful in addition to that blog post. ( A blog post which uses the example Develop a simple operator to deploy a web application using the GO Operator SDK¶)
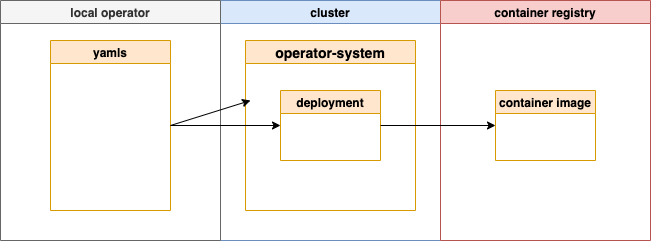
Let’s get started with a simplified architectural overview of the deployment of the operator. The operator deployment is divided in three major areas:
- The
yaml'swhich are still on the local computer where we developed the operator. - The
deploymentin an ownnamespaceon the cluster. - A
container imagein a container registry.
That is the sequence we follow to run the operator as a deployment:
- Customize the
Dockerfile - Create a container image locally
- Push the container image to a container registry
- Create the deployment
- Verify the created namespace of the deployment
- Verify if the operator deployment works
- Remove the deployment
Step 1: Customize the Dockerfile
The “out of the box” Dockerfile provided by the Operator SDK doesn’t reflect the code of the Multi Tenancy Frontend Operator. We need to add a file to the container image therefor we do customize the Dockerfile.
We just add following command to the Dockerfile.
# Copy the go source
COPY main.go main.go
COPY api/ api/
COPY controllers/ controllers/
COPY helpers/ helpers/
The image shows the changes.

Step 2: Create a container image locally
Now we will build the image using the makefile. We use Quay.io as our container registry for the container image.
- Login to Quay.io
docker login quay.io
- Use a custom container name
export REGISTRY='quay.io'
export ORG='tsuedbroecker'
export IMAGE='frontendcontroller:v3'
- Build the container using the make file
make generate
make manifests
make docker-build IMG="$REGISTRY/$ORG/$IMAGE"
If we would use podman or buildah we can customize the make file and replace the docker command with the right command. The following image shows the difference in our case.

Step 3: Push the container image to a container registry
docker push "$REGISTRY/$ORG/$IMAGE"
From now our container is available in the container registry. Now we can deploy the container to the Kubernetes cluster.
Note: For the following steps you need to ensure you set your container image visibility to public in your Quay.io repository or you need to provide to the namespace a secret to access your private container registry.
Here an example to Configure a project in an IBM Cloud Red Hat OpenShift cluster to access the IBM Cloud Container Registry and these are settings in my free Quay.io repository.

Step 4: Create the deployment
Execute following make command.
make deploy IMG="$REGISTRY/$ORG/$IMAGE"
In the code of the make file we see that the deploy command will execute the kubectl apply for the specifications in the config/manager folder. Before the kubectl apply command is executed the controller image name will be replaced with the image name we use.
.PHONY: deploy
deploy: manifests kustomize ## Deploy controller to the K8s cluster specified in ~/.kube/config.
    cd config/manager && $(KUSTOMIZE) edit set image controller=${IMG}
    $(KUSTOMIZE) build config/default | kubectl apply -f -
- Example output:
In the output we can see all yaml’s which were applied to the Kubernetes cluster.
/frontendOperator/bin/controller-gen object:headerFile="hack/boilerplate.go.txt" paths="./..."
/frontendOperator/bin/controller-gen rbac:roleName=manager-role crd webhook paths="./..." output:crd:artifacts:config=config/crd/bases
/frontendOperator/bin/controller-gen rbac:roleName=manager-role crd webhook paths="./..." output:crd:artifacts:config=config/crd/bases
cd config/manager && /frontendOperator/bin/kustomize edit set image controller=quay.io/tsuedbroecker/frontendcontroller:v1
/frontendOperator/bin/kustomize build config/default | kubectl apply -f -
namespace/frontendoperator-system created
customresourcedefinition.apiextensions.k8s.io/tenancyfrontends.multitenancy.example.net created
serviceaccount/frontendoperator-controller-manager created
role.rbac.authorization.k8s.io/frontendoperator-leader-election-role created
clusterrole.rbac.authorization.k8s.io/frontendoperator-manager-role created
clusterrole.rbac.authorization.k8s.io/frontendoperator-metrics-reader created
clusterrole.rbac.authorization.k8s.io/frontendoperator-proxy-role created
rolebinding.rbac.authorization.k8s.io/frontendoperator-leader-election-rolebinding created
clusterrolebinding.rbac.authorization.k8s.io/frontendoperator-manager-rolebinding created
clusterrolebinding.rbac.authorization.k8s.io/frontendoperator-proxy-rolebinding created
configmap/frontendoperator-manager-config created
service/frontendoperator-controller-manager-metrics-service created
deployment.apps/frontendoperator-controller-manager created
The image below shows the changes which were made during the make deploy command execution in the kustomization.yaml file.

Step 5: Verify the created namespace of the deployment
Now we see the newly created namespace for the operator that namespace is called frontendoperator-system.

Verify the content of the frontendoperator-system namespace:
kubectl get customresourcedefinition -n frontendoperator-system | grep "frontend"
kubectl get deployment -n frontendoperator-system
kubectl get service -n frontendoperator-system
kubectl get pod -n frontendoperator-system
Step 6: Verify if the operator deployment works
Create a custom resource object in the default namespace.
kubectl apply -f config/samples/multitenancy_v1alpha1_tenancyfrontend.yaml -n default
Verify the content of the default namespace:
kubectl get customresourcedefinition -n default | grep "frontend"
kubectl get tenancyfrontend -n default | grep "frontend"
kubectl get deployment -n default | grep "frontend"
kubectl get service -n default | grep "frontend"
kubectl get pod -n default | grep "frontend"
The gif below shows the working operator. We can see the created deployment of the operator and the frontend deployment with the related secrets and services.

Step 7: Remove the deployment
make undeploy
Summary
Now we have a basic understanding about how to run an operator as a deployment. That is an awesome starting point to start with operator bundles and Operator Lifecycle Manager.
I hope this was useful to you and let’s see what’s next?
Greetings,
Thomas
#operator, #go, #operatorsdk, #kubernetes, #operatorlearningjourney

Hi! Thomas,
This blog contents are so helpful to understand k8s operators.
I am testing an operator-to-pod communication and writing a simple operator that queries HTTP GET by calling http.Get() and displays the received data, which is “Hello. Docker”. A simple http server is running as a pod. The server is deployed with a StatefulSet and headless service.
To deploy the operator, I run “make deploy”. The operators is successfully deployed.
So got a few questions after following the steps that you posted above.
1. Is it possible for an operator to communicate with a pod?
2. Is there any way to show debug msg? In the Reconcile method, a few debug msgs are logged by calling “log.Info()”. When I run “kubectl -n operator-system logs operator-controller-manager”, the debug msgs are NOT displayed, but controller logs are displayed. But when I run it locally, the debug msgs are displayed.
Thanks in advance.
LikeLike
Hi chaewoorha,
thanks for your awesome feedback.
Here some comments related to your questions:
1. Is it possible for an operator to communicate with a pod?
Yes, because an operator is simplified an application which implemented in a programming language and runs on Kubernetes.
Surely, to do that you need to understand Kubernetes and the programming language to do this.
For example you can execute a kubectl command to invoke a REST endpoint inside a Pod selecting the right container:
You need to implement that invocation in go for example. PS: You find the command in the project operator-sample-go
2. Is there any way to show debug msg? In the Reconcile method, a few debug msgs are logged by calling “log.Info()”. When I run “kubectl -n operator-system logs operator-controller-manager”, the debug msgs are NOT displayed, but controller logs are displayed. But when I run it locally, the debug msgs are displayed.
First maybe you can take a look in my blog post related to debugging DEBUG A KUBERNETES OPERATOR WRITTEN IN GO .
You need to understand the context output for logging. I don’t know your debug message work. I wrote a short custom logging package for my https://github.com/thomassuedbroecker/multi-tenancy-frontend-operator/blob/main/frontendOperator/helpers/helpers.go that I can turn on and off. (ctx context.Context)
)
I hope that helps a bit and maybe my overview blog post could be also useful A SIMPLE GO OPERATOR DEVELOPMENT LEARNING JOURNEY
Regards and a nice WE
Thomas
LikeLike
Thank you so much for your quick response! 🙂
(I should have asked more specifically. Sorry for the long description below.)
My operator receives an container’s addr, calls HTTP GET to get “Hello. Docker”, and displays that msg sent by one container. This container is deployed with a StatefulSet + headless service so that ClusterIP is NOT assigned to that container. AFAIK, …svc.cluster.local is assigned to a container if it is deployed with a headless service.
The service name is “http-service” and the container’s name is “http-server-0”. And the operator’s name is “operator”.
bash-4.4$ kubectl get svc -o wide
NAME TYPE CLUSTER-IP EXTERNAL-IP PORT(S) AGE SELECTOR
http-service ClusterIP None 80/TCP 65m app=http-server
bash-4.4$ kubectl get pods -o wide
NAME READY STATUS RESTARTS AGE IP NODE NOMINATED
NODE READINESS GATES
http-server-0 1/1 Running 0 28m 172.17.0.9 minikube
bash-4.4$ kubectl get pod -n operator-system
NAME READY STATUS RESTARTS AGE
operator-controller-manager-6cdf9b5448-nv54q 2/2 Running 0 32s
/* Code snippet of Reconcile method */
import (
. . . . . . . . .
“sigs.k8s.io/controller-runtime/pkg/log”
)
func (r *OperatorReconciler) Reconcile(ctx context.Context, req ctrl.Request) (ctrl.Result, error) {
log := log.FromContext(ctx).WithValues(“Operator”, req.NamespacedName)
. . . . . . . . . . . .
spec := &instance.Spec
log.Info(“Request received”, “podURL”, spec.PodURL)
// Update spec
err = r.Update(context.TODO(), instance)
if err != nil {
log.Error(err, “Faile to update”)
return ctrl.Result{}, nil
}
// HTTP GET
log.Info(“http GET”, “podURL”, spec.PodURL)
resp, err := http.Get(spec.PodURL)
if err != nil {
log.Error(err, “http GET failed”)
resp.Body.Close()
return ctrl.Result{}, nil
} else {
log.Info(“http GET”, “Response status:”, resp.Status)
}
// Display msg received.
scanner := bufio.NewScanner(resp.Body)
for i := 0; scanner.Scan() && i < 5; i++ {
log.Info("http GET", "Received", scanner.Text())
}
if err := scanner.Err(); err != nil {
log.Error(err, "Scanner Failed")
}
resp.Body.Close()
return ctrl.Result{}, nil
}
So the custom resource 'Operator' manifest goes here:
/* myoperator.yaml */
apiVersion: example.com/v1alpha1
kind: Operator
metadata:
name: operator-sample
spec:
podURL: "http://http-server-0.http-service.default.svc.cluster.local:8080"
I observe that Reconcile method is receiving 'podURL'. However, http-server-0 does NOT respond. The http-server-0 creates a file named 'RHA' and writes "Hello. Docker" to that file and returns that msg to the client as well. Pls see below.
bash-4.4$ kubectl exec -it http-server-0 bash
root@http-server-0:/# curl http://localhost:8080
Hello, Docker!
root@http-server-0:/# cd /var/data
root@http-server-0:/var/data# ls
RHA
After running "kubectl apply -f myoperator.yaml", I checked whether that file has ben created. But the file is NOT created. This means the operator is unable to send HTTP GET with http-server-0,http-service.default.svc.cluster.local:8080
root@http-server-0:/var/data# rm -rf RHA
/*** After removing RHA, I ran "kubectl apply -f myoperator.yaml" ***/
root@http-server-0:/var/data# ls
root@http-server-0:/var/data#
So I wanted to get the debug logs that I added to the Reconcile method. But unlike deploying it locally, I couldn't get the logs. When I run it locally, the logs are displayed as below.
1.6512988519094684e+09 INFO controller.operator Request received {"reconciler group": "example.com", "reconciler kind": "Operator", "name": "operator-sample", "namespace": "default", "Operator": "default/operator-sample", "podURL": "http://http-server-0.http-service.default.svc.cluster.local:8080"}
1.6512988519170702e+09 INFO controller.operator http GET {"reconciler group": "example.com", "reconciler kind": "Operator", "name": "operator-sample", "namespace": "default", "Operator": "default/operator-sample", "podURL": "http://http-server-0.http-service.default.svc.cluster.local:8080"}
1.6512988519185042e+09 INFO controller.operator http GET {"reconciler group": "example.com", "reconciler kind": "Operator", "name": "operator-sample", "namespace": "default", "Operator": "default/operator-sample", "Response status:": "404 Not Found"}
Guess that since this is run locally, not in k8s network, the HTTP GET fails. So I deployed it onto k8s cluster by running "make deploy". However, I couldnt see the custom logs. So don't know why it fails to call HTTP GET.
I looked into your custom log function 'CustomLogs()'. Guess that this is similar to mine in Reconcile since mine is also calling log.Info() with the context.Context.
I tried to run the following cmd to get the debug logs, but as seen below, looks like these are controller or k8s system logs. The debug msgs are NOT displayed.
bash-4.4$ kubectl -n operator-system logs operator-controller-manager-6cdf9b5448-nv54q
1.6512992746191816e+09 INFO controller-runtime.metrics Metrics server is starting to listen {"addr": "127.0.0.1:8080"}
LikeLike
Hi chaewoorha, maybe I don’t get your point here is a short blog post GET YOUR CUSTOM LOGS OF YOUR OPERATOR about getting logs from your operator. Maybe that helps. Regards Thomas
LikeLike
Thank you for sharing the link! Thomas. Will go through.
LikeLike