
That blog post is about an easy example to get your custom logs of your operator, when the operator is running on a Kubernetes cluster.
That blog post does reference an example GitHub project called Example Tenancy Frontend Operator you can use to verify the steps. (branch monitor-grafana-operator)
In this project I wrote a short custom logging that can be turned off. Here is the link to the source code. In this code I use the following prefix to identify my custom logger.
Info:.
Here an example usage of the custom logging in the controller implementation for the Example Tenancy Frontend Operator:
...
var customLogger bool = true
...
helpers.CustomLogs("Create service Cluster IP", ctx, customLogger)
...
- Example output in a terminal :
1.6514790671684473e+09 INFO controller.tenancyfrontend Info:[ Create service Cluster IP ]
There are two simply ways:
- Use the Kubernetes dashboard
- Use kubectl in a terminal
Use the Kubernetes dashboard
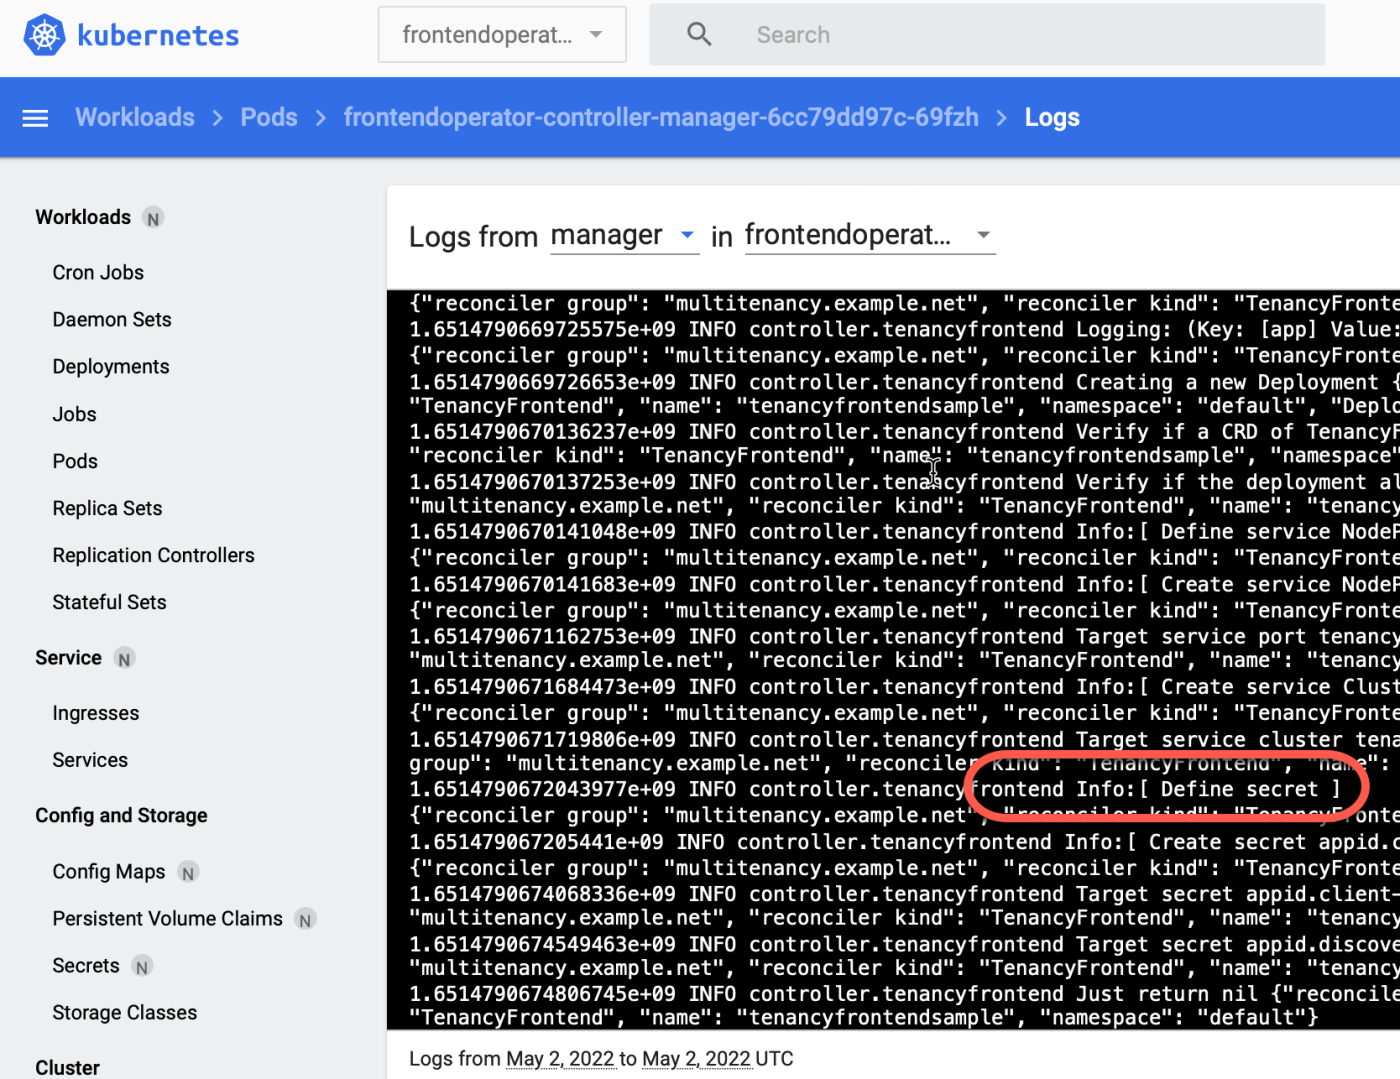
We can use the Kubernetes dashboard to access the logs of our running operator container as we see in the gif below.

Then we search the custom log in the output:

Use kubectl in a terminal
Here we use the labels of the pod to get the logs output and filter to our custom log output.
Step 1: Get the labels for running pod of the operator
kubectl get pods -n frontendoperator-system --show-labels
- Example output:
NAME                                                   READY   STATUS    RESTARTS   AGE   LABELS
frontendoperator-controller-manager-6cc79dd97c-69fzh   2/2     Running   0          29m   control-plane=controller-manager,pod-template-hash=6cc79dd97c
Step 2: Get the specific log output you defined
Let us get all logs from all Kubernetes resources in frontendoperator-system namespace and filter them into the custom format we created.
kubectl logs -l control-plane=controller-manager -n frontendoperator-system | grep "Info:"
- Example output:
Here we see the steps where I used the custom logs.
1.6514790671684473e+09  INFO    controller.tenancyfrontend      Info:[ Create service Cluster IP ]
1.6514790672043977e+09  INFO    controller.tenancyfrontend      Info:[ Define secret ]
1.651479067205441e+09   INFO    controller.tenancyfrontend      Info:[ Create secret appid.client-id-frontend ]
Summary
In some situations it could be useful to have that simply kind of filtering for a custom log output. If you want to setup the sample visit the blog post Example for an installation and an initial configuration of the Grafana operator.
I hope this was useful to you and let’s see what’s next?
Greetings,
Thomas
#operatorsdk, #operators, #kubernetes, #logging

Leave a comment