

This blog post is a short cheat sheet for:
- How to simply organize workspaces and the debugging configuration separated from source code saved in
GitHub. - How to simply configure attach debug for Quarkus in Visual Studio Code
The advantage with that organization is:
You can easily delete the source code saved in GitHub from your local machine, but you don’t lose the debugging or other configurations you did.
In case that you will work again on the source code of the deleted GitHub project, you don’t need to setup these configurations again, because you can just add/link cloned GitHub source code project once more to your Visual Studio Code workspace project, which is still on your local machine.
Surely, an additional option is: You can save the “*.code-workspace” file, the “.vscode” folder, the “launch.json” and other configurations files in the same folder as your GitHub project. In this case you need to add these files and folders to the “.gitignore” file to prevent the upload into the GitHub project. But, I want to keep all my configurations and settings separated, just to ensure that I will keep all configurations for the projects, even when I deleted the GitHub project from my machine.
Step 1: Create a root folder for the Visual Studio Code workspaces and configurations projects
Separate the Visual Studio Code configurations from the GitHub source code projects. So, we have a root folder for Visual Studio Code configuration and workspace files and one root folder for the GitHub projects.
Example names:
| Folder Name | Comment |
|---|---|
| vsc-workspaces | Root folder for the Visual Studio Code configurations projects |
| dev | Root folder for the GitHub source code projects |
Step 2: Create a folder for a Visual Studio Code workspace project and add the GitHub project folders
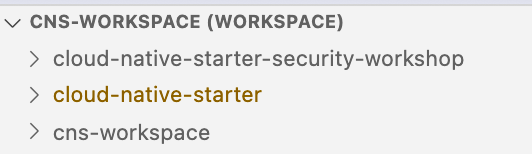
In this example situation I used cns-workspace for the cloud native starter workspace project.
The two folder names vsc-workspaces/cns-workspace.
| Folder Name | Comment |
|---|---|
| vsc-workspaces | Root folder for all Visual Studio Code configurations projects. |
| cns-workspace | One concrete workspace project folder, which is mainly for the configurations and workspace files. The GitHub source code project folders, will only be linked in the next step to that workspace project. |
In the image you see two cloud native starter (cns) GitHub projects and the newly created workspace project.
Step 3: Save the workspace file
In this example situation I use cns-workspace project, where I save my configurations.
The workspace file name (cns-workspace.code-workspace) and the folders:
- vsc-workspaces/cns-workspace/cns-workspace.code-workspace
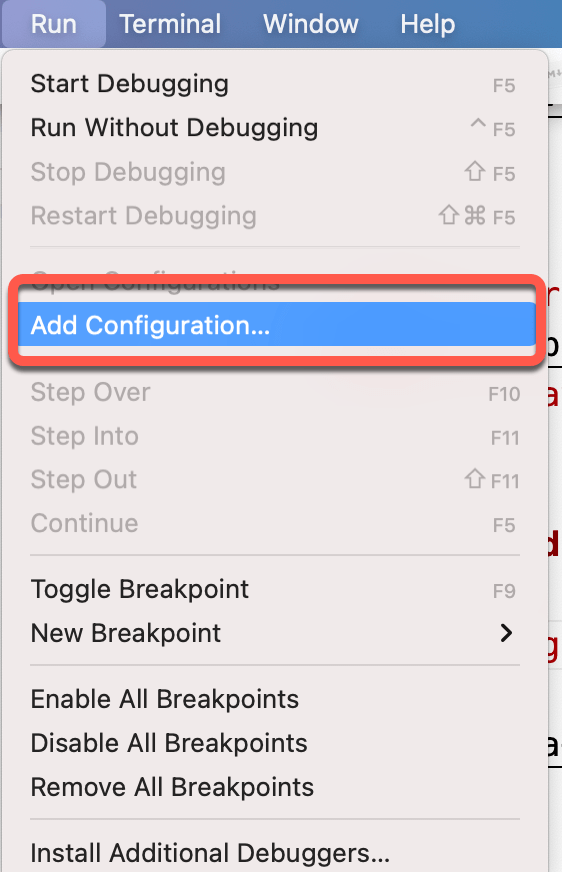
Step 4: Add debug configuration to the Visual Studio Code workspace
Ensure the extension pack “Java Extension Pack” is installed. That also includes following extensions and more:
Add the debug configuration to the launch.json file.
In the following image you see folder structure used for that example.

Here is content of launch.json file.
5005is the debug port for Quarkus7777is the debug port for OpenLiberty
{
    // Use IntelliSense to learn about possible attributes.
    // Hover to view descriptions of existing attributes.
    // For more information, visit: https://go.microsoft.com/fwlink/?linkid=830387
    "version": "0.2.0",
    "configurations": [
        {
            "type": "java",
            "name": "Remote Debug (Attach Quarkus)",
            "request": "attach",
            "hostName": "localhost",
            "port": 5005
        },
        {
            "type": "java",
            "name": "Remote Debug (Attach OpenLiberty)",
            "request": "attach",
            "hostName": "localhost",
            "port": 7777
        },
        {
            "type": "java",
            "name": "Launch Current File",
            "request": "launch",
            "mainClass": "${file}"
        },
    ]
}
Step 5: Start your Quarkus application and debug
Ensure you have an active breakpoint in your source code.
The gif below shows following steps:
- Start Quarkus in the development mode.
With:mvn clean package quarkus:dev - Attach the debugger to port
5005 - Change to the debug view in
Visual Studio Code - Invoke a REST endpoint of the mircoservice
- Debug the mircoservice running in Quarkus

I hope this was useful for you and let’s see what’s next?
Greetings,
Thomas
#quarkus, #visualstudiocode, #vscode, #java, #debug

FYI, the vscode-quarkus extension (https://marketplace.visualstudio.com/items?itemName=redhat.vscode-quarkus) allows you to launch your Quarkus in dev mode and attach the debugger with a single command. See https://quarkus.io/blog/quarkus-developer-joy-for-vs-code/#debugging-a-quarkus-project
LikeLike
Hi Fred, thanks for your feedback.
LikeLike
Thanks for the hint. When I try this, the project starts, the debugger is attached, but no breakpoint is hit. I can’t figure out why. Any hints?
LikeLike